Example 4, Paris
<<< Back to examples
Figure 1 shows measured and calculated sound levels in streets in Paris. The measurements were performed mainly in busy streets, but some quiet residential areas were also included. Measured levels in the quiet areas are in the range 50-60 dB. Calculated levels are based on average traffic volumes for the day period. The results in Fig. 1 again confirm the general picture: high traffic noise levels occur primarily near busy streets, and levels are lower in quiet areas between busy streets.
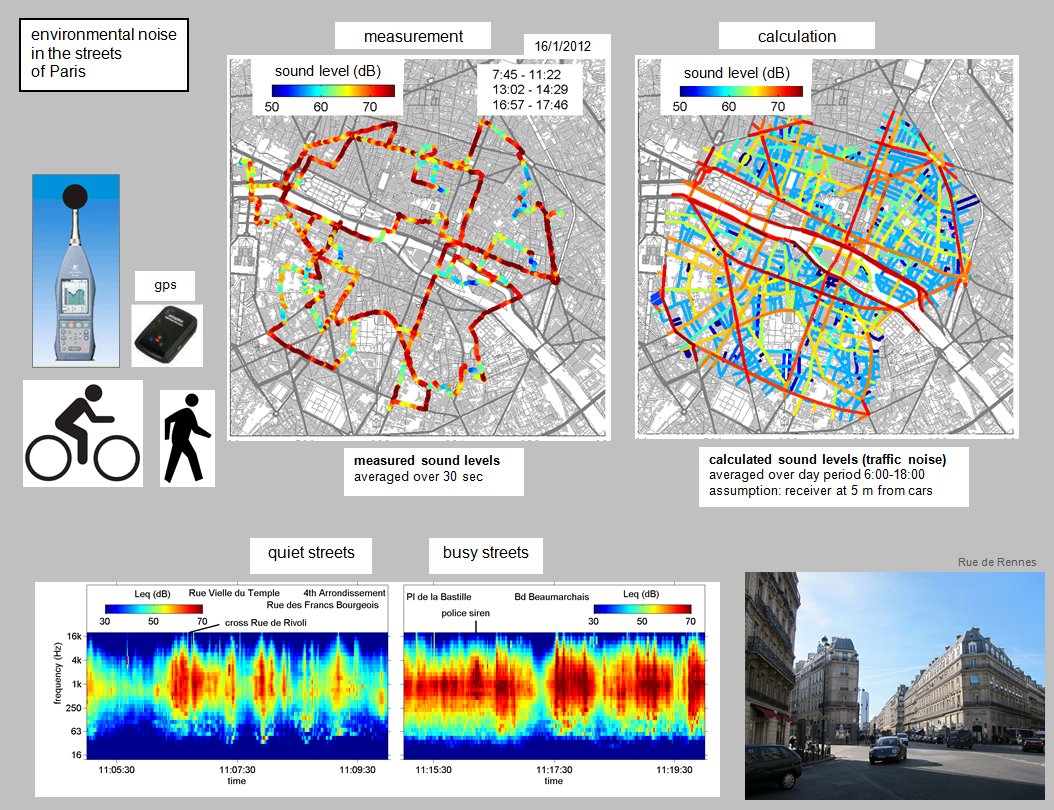
Figure 1. Measured and calculated noise levels in streets in Paris. The measurements were performed by bicycle and by foot. For the calculations, average traffic volumes for the day period were used. Spectrograms in quiet streets and busy streets are shown.